
Return on ad spend (ROAS) is defined as the gross revenue generated for every dollar spent on advertising, calculated by dividing total attributed revenue by total ad spend. If you spend $1,000 on Google Ads and generate $4,000 in sales, your ROAS is 4:1, meaning four dollars back for every one dollar out. Marketers express this as a ratio (4:1), a multiplier (4.0x), or a percentage (400%). Understanding ad spend returns is not optional for anyone managing a paid media budget. It is the first number you check to know whether a campaign is working.
How to calculate return on ad spend
The ROAS formula is straightforward: ROAS = Revenue Attributed to Ads / Ad Spend. What trips people up is not the math. It is knowing exactly what to count on each side of the equation.
Here is a step-by-step process for calculating ROAS accurately:
- Identify your ad spend. Include all platform fees paid to Google Ads, Meta Ads, or TikTok Ads. Standard practice excludes agency management fees and creative production costs from this figure, though some businesses choose to include them for a fuller picture.
- Pull attributed revenue. Use the same time window as your ad spend. If you are measuring a 30-day campaign, count only revenue attributed to that 30-day period.
- Apply the formula. Divide total attributed revenue by total ad spend. A $500 spend generating $1,750 in revenue produces a ROAS of 3.5x, or $3.50 returned per dollar spent.
- Choose your format. Google Ads displays ROAS as a multiplier by default. Most media buyers use the multiplier shorthand in dashboards and reports. Either format works as long as you stay consistent within a reporting period.
- Adjust for net ROAS. Experienced media buyers subtract refunds and platform transaction fees from revenue before dividing. This net ROAS calculation reflects actual cash inflow rather than gross revenue, giving you a cleaner read on campaign health.
Pro Tip: Always subtract refunds before calculating ROAS. A campaign that generated $5,000 in gross revenue but had $800 in refunds produced only $4,200 in real revenue. Ignoring refunds inflates your numbers and leads to budget decisions based on money you never actually collected.
How does ROAS differ from ROI?

ROAS and ROI measure different things. Confusing them is one of the most expensive mistakes a marketing team can make.
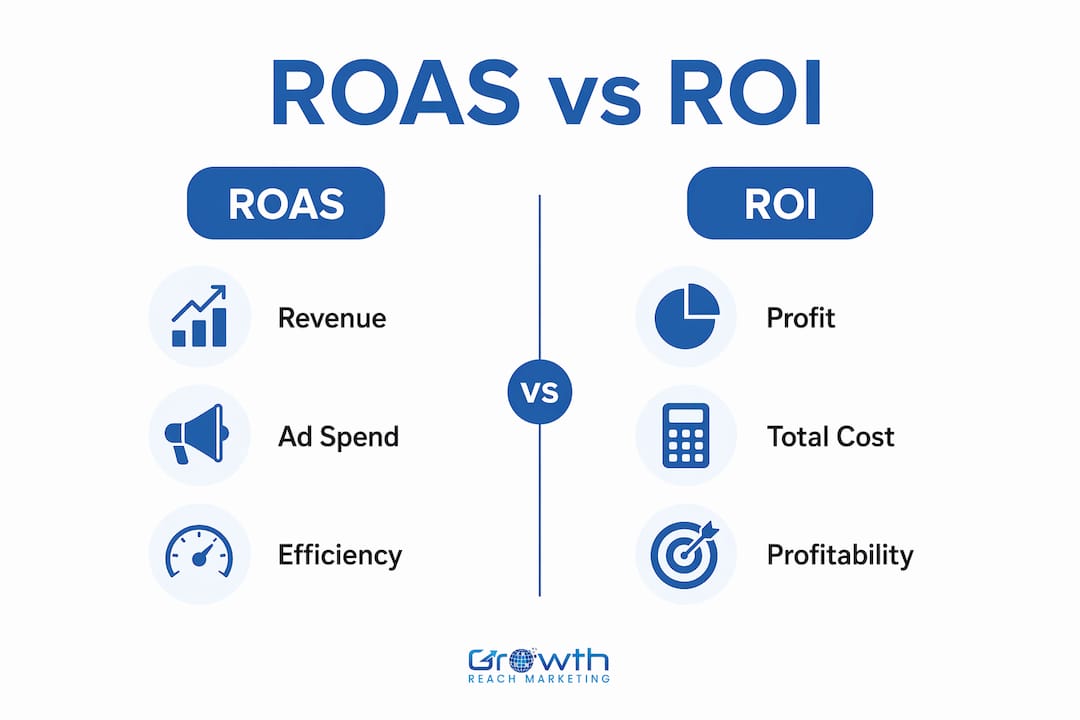
ROAS measures revenue against ad spend only. It tells you how efficiently your advertising generates revenue. ROI, by contrast, accounts for every business cost: cost of goods sold (COGS), salaries, overhead, fulfillment, and more. A campaign can show a strong 4.0x ROAS while delivering a negative ROI once you factor in what it actually costs to produce and deliver the product.
Here is a comparison that makes the distinction concrete:
| Factor | ROAS | ROI |
|---|---|---|
| What it measures | Revenue vs. ad spend | Profit vs. total costs |
| Formula | Revenue / Ad Spend | (Net Profit / Total Investment) x 100 |
| Costs included | Ad platform spend only | COGS, overhead, salaries, ad spend |
| Best used for | Campaign-level efficiency | Overall business profitability |
| Limitation | Ignores full cost structure | Harder to attribute to one channel |
ROAS is the right metric for deciding whether to scale, pause, or reallocate a specific campaign. ROI is the right metric for evaluating whether the business is actually making money. You need both. Using ROAS alone to declare a campaign profitable is a common and costly error.
The concept of breakeven ROAS ties these two metrics together. Breakeven ROAS equals 1 divided by your gross margin percentage. A business running at a 40% gross margin has a breakeven ROAS of 2.5x. Any campaign below that threshold loses money, even if the ROAS is above 1.0x. This is the number every business owner should calculate before setting a ROAS target.
What are the most common ROAS misconceptions?
The biggest misconception about ROAS is that any number above 1.0x signals profit. It does not. A 1.5x ROAS means you collected $1.50 for every $1.00 spent on ads. If your gross margin is 40%, your breakeven ROAS is 2.5x. That 1.5x campaign is losing money on every sale.
Several other misunderstandings regularly derail ROAS-based decisions:
- Time window mismatch. Comparing all-time sales to a 30-day ad spend inflates ROAS artificially. Revenue and spend must cover the same period. This is one of the most common errors in e-commerce reporting.
- Standard ROAS vs. incremental ROAS. Standard ROAS includes revenue from customers who would have purchased regardless of seeing your ad. Incremental ROAS isolates truly ad-driven revenue, making it a more accurate measure of advertising effectiveness. It is harder to calculate but far more honest.
- Scaling without checking diminishing returns. ROAS signals whether to increase ad budgets, but scaling beyond your qualified audience drives up cost per click and drives down ROAS. A campaign performing at 5.0x on a $2,000 budget will rarely hold that number at $20,000.
- Universal benchmarks without margin context. A commonly cited general target is 4:1 ROAS, but this number is meaningless without knowing your margin. A luxury service business with 70% margins can profit at 2.0x. A product business with 20% margins needs 5.0x just to break even.
Pro Tip: Never evaluate ROAS in isolation. Pair it with cost per acquisition (CPA), customer lifetime value (LTV), and gross margin to get a complete picture. A campaign with a 6.0x ROAS but a $900 CPA may be unsustainable if your average customer only buys once.
How do you optimize ROAS for better ad results?
Improving your ROAS starts with knowing exactly where revenue is leaking. These steps give you a structured approach to increasing ad spend efficiency.
- Set a margin-based ROAS target first. Calculate your breakeven ROAS using the formula: 1 / gross margin. Then set your target ROAS above that number. This gives your campaigns a mathematically grounded goal rather than an industry guess.
- Tighten your audience targeting. Broad audiences waste spend on users unlikely to convert. Narrowing by intent signals, lookalike audiences, or geographic focus typically raises ROAS by reducing irrelevant impressions. For local service businesses, this is often the single highest-impact change.
- Test creative systematically. Ad creative is the most controllable variable in most campaigns. Run A/B tests on headlines, images, and calls to action. Identify which creative combinations drive the highest revenue per click, then reallocate budget toward winners.
- Align your attribution window with your sales cycle. A business with a 7-day consideration period should use a 7-day click attribution window, not a 1-day window. Misaligned windows undercount revenue and make campaigns look worse than they are. Tools like HubSpot, Singular, and Improvado integrate multi-touch attribution to give you a more complete revenue picture across channels.
- Use ROAS thresholds to automate budget decisions. Set rules in Google Ads or Meta Ads to increase budget when ROAS exceeds your target and reduce spend when it falls below breakeven. This removes emotion from budget decisions and keeps campaigns within profitable parameters.
- Measure cross-channel ROAS carefully. Each ad platform claims credit for conversions, which leads to double-counting. A customer who clicked a Facebook ad and then a Google Shopping ad may show up in both platforms’ ROAS reports. Marketing mix modeling or a unified analytics platform resolves this overlap and gives you an accurate total picture.
Understanding how pay-per-click advertising works at a structural level also helps you identify where ROAS is being dragged down by poor campaign architecture rather than weak creative or targeting.
Key takeaways
ROAS is the revenue-per-dollar metric that drives campaign-level decisions, but it only delivers value when calculated correctly and interpreted against your actual gross margin.
| Point | Details |
|---|---|
| ROAS formula | Divide total attributed revenue by total ad spend for the same time period. |
| Breakeven ROAS | Calculate as 1 divided by gross margin; any ROAS below this loses money. |
| ROAS vs. ROI | ROAS measures campaign efficiency; ROI measures total business profitability. |
| Net ROAS accuracy | Subtract refunds and fees before dividing to reflect real cash inflow. |
| Scaling risk | Diminishing returns reduce ROAS as spend grows beyond the qualified audience. |
Why most businesses read ROAS wrong
I have reviewed ad accounts for salons, aesthetic clinics, and local service businesses where the owner was genuinely proud of a 3.0x ROAS. In several cases, that number was below their breakeven threshold. They were spending more to acquire customers than those customers were worth in gross profit. The campaigns were technically generating revenue. The business was losing money.
The problem is not that ROAS is a bad metric. It is that most people treat it as a pass/fail score rather than a diagnostic tool. A 4.0x ROAS in a high-margin business is good. A 4.0x ROAS in a low-margin business might still be unprofitable. Context is everything.
What I have found works consistently is building a one-page ROAS dashboard that shows three numbers side by side: current ROAS, breakeven ROAS, and CPA. When all three are visible, budget decisions become obvious. You stop chasing a generic benchmark and start managing to your actual numbers.
The other shift worth making in 2026 is moving toward incremental ROAS measurement wherever possible. Standard ROAS overstates ad impact because it counts revenue that would have happened anyway. Incremental ROAS is harder to set up, but it tells you what your ads are actually doing. That distinction matters more as ad costs rise and margins compress.
— Gerard
How Growthreachmarketing can improve your ad spend returns
Knowing your ROAS number is one thing. Knowing what to do with it is another. Growthreachmarketing works with salons, aesthetic clinics, and local service businesses to build paid advertising systems that are grounded in margin-based targets, not guesswork.

From Google Ads campaign structure to attribution setup and creative testing, the team at Growthreachmarketing builds campaigns designed to hit your specific breakeven threshold and scale from there. If your current campaigns are generating revenue but you are not sure whether they are actually profitable, that is exactly the conversation worth having. Explore how seasonal ad strategies connect to SEO to maximize your total marketing return, or learn more about why paid ad spend fails for clinics running campaigns without the right structure in place.
FAQ
What does return on ad spend mean in simple terms?
Return on ad spend (ROAS) measures how much revenue you earn for every dollar spent on advertising. A 4:1 ROAS means you generated $4 in revenue for every $1 spent on ads.
What is a good ROAS benchmark?
A commonly cited target is 4:1, but the right ROAS depends on your gross margin. Your breakeven ROAS equals 1 divided by your gross margin percentage, and your target should sit above that number.
How is ROAS different from ROI?
ROAS only compares revenue to ad spend. ROI factors in all business costs including production, salaries, and overhead, making it a broader measure of overall profitability.
What is incremental ROAS and why does it matter?
Incremental ROAS measures only the revenue directly caused by your ads, excluding purchases that would have happened without them. It is a more accurate indicator of true advertising effectiveness than standard ROAS.
Which tools track ROAS across multiple channels?
Platforms like HubSpot, Singular, and Improvado track ROAS and integrate multi-touch attribution to give marketers a unified view of ad performance across channels.